MNRANKv1
The Minnesota Statistical PR Returns!
Good morning, Minnesota Smash!
We have been without a new set of rankings for our scene for over six months, and it’s about time we fixed that. What I will be presenting here is not exactly what you’re used to if you recall the statistical PRs from Smash 4 or the first season of Ultimate. If anything, that system was too complicated for its own good — the ridiculous amount of data collection and the proprietary software necessary to run the numbers was a big reason why the Season 2 power rankings expected this past fall never happened.
I’m going to be up front about it: this system is much simpler than the old one. But I think what I’ve put together here will allow me to quickly and reliably put together a ranking that properly summarizes a season of Minnesota Smash, crediting players properly for consistent high placements in brackets and rewarding them for their peaks and their ability to take down the strongest players in the scene.
The way it works is that we first compile the Bracket Score with the help of the Braacket.com site on which we store every single bracket of at least 24 players or more run in the state. The formula to calculate this is weighted by attendance with multipliers to give further significance to regionals (like Papercut) or PGR events (like Overextend). Points are awarded for placements as follows (and I did include any non-weekly out-of-state event in the calculations, even though they do not appear on the Braacket):
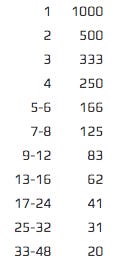
The mathematically inclined will notice it follows a simple pattern: Placement value = 1000/x where x is the number of people left in bracket when you were eliminated (9th is top 12, so 9th gets 1000/12 = 83, with rounding). I may tweak this for further seasons, but I was happy with the results after running that portion. That number is then multiplied by the number of entrants and the tournament multiplier and then divided by 100. For example, then, winning a 50-person GameWorks weekly was worth 500 points, and getting 7th was worth 62.5. At Overextend, which had 234 entrants, 7th was worth 125 * (234/100) * 3, the PGR event multiplier, which comes out to 878 points — more than winning a typical weekly, which I think accurately reflects the importance of that event (the single largest smash bracket ever ran in MN) to our scene.
Bracket Score heavily rewards attendance. Showing up constantly and finishing 9th or 17th will be worth more than showing up just a few times, even if those few times result in top 4 finishes. To account for that issue, I added a second ranking, Win Score, which uses Bracket Score to value wins for the season. The Win Score is simply the average Bracket Score of a player’s 10 best wins for the season. Players from out-of-state were accounted for here, with a subjective value used to fit their respective strength. This allows us to properly reward somebody like Stevenshark, who showed he was a top player in the few tournaments he attended through his victories.
From there, I simply averaged the two scores, and Voila!, we have MNRANK!
To be clear, there is a significant amount of subjectivity here, and a few decisions were arbitrary. Why 1/x rather than, say, 1/x² for the Bracket Score? Why not follow the model of, say, the Capcom Cup’s point rankings rather than make up my own? (The answer there, for the record, is I couldn’t figure out what their methodology was for coming up with the point values they use.) Why the best 10 wins rather than five, or 15? Frankly, the answer to most of these questions is simplicity. From my tinkering, this ranking does a fine job of summarizing what happened last season in a single number. But boiling seven months and dozens of tournaments down to a single number is always going to leave part of the story untold, and that’s where the voters come in.
The top 20 in this ranking will be contacted by me over discord and will be asked for a ballot of their ranked Top 10 for the season. Any further information about the season can be found on the Braacket, including, most importantly, full head-to-head data for the entire season. Please, for the love of all that is holy, do NOT consider this single number to be gospel. Y’all have brains, and I implore you to use them. If you disagree with anything this — fairly crude! — ranking system spit out, PLEASE reflect that on your ballots.
Without further ado, then, here are the full rankings for MNRANKv1, covering Ultimate’s second season in the state, spanning May 1st, 2019 through December 31st, 2019. Congratulations to everyone who made the list!
yeti (55009)
Skorpio (16096)
Lucky (16062)
Loaf (15547)
Cookietic (15292)
NameLess (14677)
Thor (13432)
Zubat (7268)
Stevenshark (6932)
Failbot (6508)
Visitor (6101)
DNA (5508)
Grady (5501)
Jackie Peanuts (5378)
Dirty Wizard (5351)
Disco (5334)
Red (4681)
Dwn4thekaz (4593)
Drip (4187)
Natu (4084)
Van (3790)
SilverPC (3617)
DatDerpDog (3074)
Fluffy (3047)
Aura Wolf (2973)
Green T (2643)
PK (2587)
DaneReich (2584)
YungSavage (2538)
KingOfWizards (2497)
Weeaboo (2421)
Aero (2370)
JStrudel (2355)
Caravan Puff (2354)
Alphamew (2226)
Birzes (2036)
Big Papa (1943)
Chess (1862)
Vacant (1709)
Tosty (1696)
mom (1680)
Reese (1611)
Stealth Pilot (1532)
Linger (1443)
DREWGANGGOD (1420)
Oljace (1399)
Fishbowl (1256)
kden (1230)
Cinnabread (1150)
Canon (1131)
Special thanks to PK for his help compiling data and discussing the methodology.
EDIT: Missed one tournament, UMN Earth Wind & FIYAH!
Changes from original:
Loaf +1, Cookietic -1
DNA +1, Grady +1
Dirty Wizard +1, Disco -1
Fluffy +1, Aura Wolf -1
DaneReich +1, YungSavage -1
Aero +2, JStrudel -1, Caravan Puff -1